Friday 31 October 2014

Voting intention versus who would make best PM.

https://yougov.co.uk/refer/HdvYK1txkm0PfdJX43_Iow/  <<< Follow the link if you would like to join the YOUGOV panel and have your opinions heard


http://cdn.yougov.com/cumulus_uploads/document/nesj1j60m0/YG-Archive-Pol-Sun-results-301014.pdf

Council by election results for the 30th October

Castle Point, Canvey Island East - Independent gain from Canvey Island Independent

Party  2014 B votes     2014 B share     since 2014     since 2012     since 2011     since 2010   
Independent         389        39.1%from nowherefrom nowherefrom nowherefrom nowhere
Canvey Island Independent           323        32.4%      -34.4%      -15.6%      -23.8%      -19.7%
Conservative         208        20.9%        -0.2%        -2.6%        -8.9%      -13.6%
Labour           76          7.6%        -4.5%        -5.1%        -6.4%        -5.7%
Past Independent


      -15.7%

Total votes         996
          66%          80%         58%         33%

Swing not meaningful

Neath Port Talbot - Sandsfields East - Labour hold

Party  2014 votes     2014 share     since 2013 B   since 2012 "top"since 2012 "average"since 2008 "top"since 2008 "average"
Labour         641       61.1%        +1.4%        +24.3%          +24.5%        +31.0%          +33.3%
UKIP         361       34.4%      +21.6%  from nowhere     from nowhere  from nowhere      from nowhere
Conservative           47         4.5%        +1.2%  from nowhere     from nowhere  from nowhere     from nowhere
Barry Kirk *

      -18.5%        -23.7%          -27.6%        -12.1%          -12.6%   
Plaid Cymru

        -5.7%


Independents   


        -39.5%          -35.8%        -40.9%          -42.7%
NPT Ratepayers   


        -17.0%          -16.9%
Row 9 column 1     1,049
         87%           37%             43%           34%             36%

* contested 2013 by-election as Port Talbot Residents Association, 2012 as Neath Port Talbot Independent and 2008 as New Millenium Bean Party

Swing Labour to UKIP ~10% ssince c2013 by-election lagely as others coalesce around UKIP but otherwise not meaningful

North Ayrshire, North Coast & Cumbraes - SNP hold

'- based on 1st preference

Party  2014 votes     2014 share     since 2012     since 2007   
SNP       2,021       38.7%      -6.2%      -0.6%
Independent         1,190       22.8%from nowherefrom nowhere
Conservative          1,125       21.6%      +3.2%      -0.6%
Labour          691       13.2%      -5.1%      -6.6%
UKIP          192          3.7%from nowherefrom nowhere
Past Independents  

     -16.3%    -12.4%
Socialist Labour   

       -2.0%
Liberal Democrat   


      -6.3%
Total votes       5,219
         84%        67%

Swing not meaningful

Telford & Wrekin, Ironbridge Gorge - Labour hold

Party  2014 votes     2014 share     since 2011     since 2007     since 2003   
Labour         325       44.1%       -8.9%      -11.1%      -11.6%
Conservative         276       37.4%       -9.6%        -7.4%      +12.9%
UKIP         136       18.5%from nowherefrom nowherefrom nowhere
Liberal Democrat  


      -19.7%
Total votes         737
        66%         80%         67%

Swing Conservative to Labour ~0.4% since 2011 but Labour to Conservative ~2% since 2007

Telford & Wrekin, Newport East - Independent gain from Conservative

Party  2014 votes     2014 share     since 2011     since 2007     since 2003   
Independent         264       39.8%from nowherefrom nowherefrom nowhere
Conservative            179       27.0%      -37.0%      -53.1%        +2.5%
UKIP         157       23.7%from nowherefrom nowherefrom nowhere
Labour           63         9.5%      -26.5%      -10.4%             -11.4%
Past Independent  


      -38.1%
Liberal Democrat   


      -16.4%
Total votes           663
         70%         72%         60%

Swing not meaningful

Thursday 30 October 2014

2015 UK Parliamentary Election Forecast (30th OCT)

This report was generated on 30 October 2014 at 13:42. To read commentary on the election using these forecasts, follow Election4castUK on Twitter. If you would like to give us feedback on this forecast, please email us at

Party Lo Seats Hi Swing
Conservatives 236 281 327 -25
Labour 251 297 340 39
Liberal Democrats 13 23 36 -34
SNP 14 24 34 18
Plaid Cymru 1 3 5 0
Greens 0 0 1 -1
UKIP 1 3 7 3
Other 1 1 3 0
Seat-by-seat predictions based on the party predicted to be most likely to win each seat.
The following tables focuses on potential seat gains and losses for each of the parties, including only those seats for which the probability of a change of control is estimated at over 10%. If the table is blank, there are currently no such seats.
Conservatives: Gains Losses
Labour: Gains Losses
Liberal Democrats: Gains Losses
SNP: Gains Losses
Plaid Cymru: Gains Losses
Greens: Gains Losses
UKIP: Gains

Latest Ipsos Mori Scottish poll

https://www.ipsos-mori.com/Assets/Docs/Publications/PUBLIC%20SPOM%20Wave%2022%20Tabs%20-%20FINAL%20FOR%20WEBSITE%20GENERAL%20ELECTION.pdf

YOUGOV (GREENS v YELLOWS)

https://yougov.co.uk/refer/HdvYK1txkm0PfdJX43_Iow/  <<< Follow the link if you would like to join the YOUGOV panel and have your opinions heard

http://cdn.yougov.com/cumulus_uploads/document/xzvh9rrpyj/YG-Archive-Pol-Sun-results-291014.pdf 

Wednesday 29 October 2014

2015 UK Parliamentary Election Forecast (29th OCT)

This report was generated on 29 October 2014 at 13:25. To read commentary on the election using these forecasts, follow Election4castUK on Twitter. If you would like to give us feedback on this forecast, please email us at feedback@electionforecast.co.uk

The following tables focuses on potential seat gains and losses for each of the parties, including only those seats for which the probability of a change of control is estimated at over 10%. If the table is blank, there are currently no such seats.
Conservatives: Gains Losses
Labour: Gains Losses
Liberal Democrats: Gains Losses
SNP: Gains Losses
Plaid Cymru: Gains Losses
Greens: Gains Losses
UKIP: Gains

Party Lo Seats Hi Swing
Conservatives 235 280 328 -26
Labour 251 298 341 40
Liberal Democrats 14 24 37 -33
SNP 15 23 33 17
Plaid Cymru 1 3 4 0
Greens 0 0 1 -1
UKIP 1 3 6 3
Other 1 1 3 0
Seat-by-seat predictions based on the party predicted to be most likely to win each seat.

A pint with Craig Tracey, the Conservative candidate for North Warwickshire

FROM THE FANTASTIC 50FOR15 BLOG Link to blog 

 Link to Warwickshire North candidates

Most people have an extended period of time from deciding to run as a candidate in a seat to their successful selection as the Prospective Parliamentary Candidate. Not so for Craig Tracey, the Conservative candidate for North Warwickshire. Shortly after the resignation of the current Conservative MP, Dan Byles, Craig was chosen as the local party’s candidate. A fortnight later he got married, and a week after his wedding he was in Birmingham for the Conservative Party Conference, where, after this “whirlwind” of events, it seemed only fair to meet him in a pub.
We chatted about the importance of the Party Conference for candidates in marginal seats, his reservations over HS2, and why he’ll be in the pub a whole lot more over the next few months…
Adam met Craig Tracey, the Conservative candidate for North Warwickshire, at the Conservative Party Conference
What’s different about Conference when you’re based in such a marginal constituency?
It’s very different in terms of it being the one opportunity where we get a lot of activists together in the same place, where you get a lot of MPs together, and you can go and talk to them and get them on board to help your campaign. Politics is a people business, and if a MP connects with you, then they are more likely to send people from the safer seats to help you out. We have had quite a few offers of help which is fantastic. We are a small association, just over a hundred members, so having extra bodies on the ground is what is going to help us.
You were chairman of the North Warwickshire Conservative Association and now you’re the candidate. What’s the transition like?
As chairman, you have to make quite difficult decisions and things that you do are not universally popular. When you are the candidate you have to bring everybody together and have them all working for you, so it’s quite an interesting transformation. It’s been fun and people have been very supportive, which is great. I’ll probably know more in a week or two once there’s been more time to campaign! I have been really impressed with all the support and the emails coming through.
Your Labour opponent, Mike O’Brien, was the former MP – how does that pose a challenge to your campaign?
He was my MP! I think it actually helps us because he’s lost twice now, and he’s coming up again. It seems like Labour cannot come up with a better candidate for the seat. From my point of view, he’s somebody who has twice been rejected by voters and he’s supposedly the best they can find.
I’ve campaigned against him so I know how he works and operates. He is known in the area, but then there are things that he has done which aren’t popular. When I have been out on the doorstep speaking to people it’s evident that they haven’t forgotten the things that he has done. A more dynamic candidate coming in would have been a much bigger threat.
What are the key issues to voters in North Warwickshire?
The most emotive one from the national level is High Speed Rail, HS2. It affects a lot of the constituency. We also have the George Eliot Hospital which turned from a bad news story into a good news story, and has been performing so much better over the last 6 months. If you look at North Warwickshire, it’s such a diverse constituency. There are lots of rural areas, lots of market towns, lots of ex-mining areas, so there’s not really encompassing issue for the whole area, except for planning, which is a huge issue. The two borough councils that look after North Warwickshire have failed to have a credible housing plan.
My first campaign is on road safety which is something I am passionate about. My day job is as an insurance broker so I see the other side of the effects that things like speeding has so that was natural campaign for me but it is also an issue that has been raised lots on the doorstep, especially in rural communities.
What are your opinions on HS2?
I just cannot see the business case for it. I have campaigned with Dan Byles, and have campaigned on this issue over the years. It’s a very difficult project to justify.
Craig Tracey (right) with Dan Byles, the outgoing Conservative MP for North Warwickshire
So why do you think the leadership of the Conservative Party are supporting it?
They believe that it is a project which will develop long term economic benefits, of which the connectivity to the North is a key rationale. But for the people of North Warwickshire it doesn’t offer value for money. I would rather see the existing rail provision updated and made quicker. We know that there is going to be a problem with rail in terms of capacity, so there is going to have to be something done. The project has got cross-party support which makes it unlikely that we’re going to be able to stop it, but then it’s a case of getting the best mitigation for the people who will be affected.
One of the things you don’t hear about is that when HS2 is going through an area it affects house prices so we need to ensure that compensation packages are delivered quickly and are fair. Dan has been incredibly proactive as the voice against HS2 and I think he has gained a lot of respect for that. If you go out to meetings and talk to people everybody know how much he is doing and how much he has helped us.
So with six months to go, what are the key considerations of your campaign going to be?
When a new candidate is selected the most important thing is to get out and knock on doors. Leaflets are great, but the more people you can talk to the better. That is what I’ll be focusing on throughout the election but certainly while the evenings are longer. The campaign will be about getting out there and meeting as many people as possible and organising residents’ meetings.
We’re going to do some ‘In the Pub with Craig’ meetings. I organised similar meetings in the pub for Dan at the last election and they were really good way to engage voters who may not have been engaged in politics before. It’s a bit like learning – people learn in different ways and you have got to encapsulate different styles of learning and get our strong messages out because we have strong messages to tell.

YOUGOV (YIN v YANG)

https://yougov.co.uk/refer/HdvYK1txkm0PfdJX43_Iow/  <<< Follow the link if you would like to join the YOUGOV panel and have your opinions heard

http://cdn.yougov.com/cumulus_uploads/document/7owpm4rc6q/YG-Archive-Pol-Sun-results-281014.pdf 

Tuesday 28 October 2014

SOUTH YORKS PCC PREDICTION COMPETITION

So we have another prediction competition, the prize is a retweet from our twitter account which has now smashed through 5,000 followers.

All you need to do is predict the winner and what % share of the vote they win with.

so a entry would be for instance

*** as it was so kindly pointed out, the percentage is based on the 1st preference votes ***

Labour - 42.16%

So firstly only entries with the correct winning candidate will have a chance of winning. It is then whoever is closest to their vote share which will win, I do suggest going to 2 decimal places.

Also please leave a twitter account with your entry or log in via blog account and we will re tweet your blog or twitter account.

Our decision is final on who we will or not retweet.

All entries to be left in the comment section please.

If you want help with the form guide read the post below.

SOUTH YORKSHIRE PCC ELECTION RESULTS VERSUS EURO 2014

David Allen - English Democrats
Allen Billings - Labour
Jack Clarkson - UKIP
Ian Walker - Conservative

2015 UK Parliamentary Election Forecast (28th OCT)

This report was generated on 28 October 2014 at 10:25. To read commentary on the election using these forecasts, follow Election4castUK on Twitter. If you would like to give us feedback on this forecast, please email us at


  • And now the party forecast...
    • Conservatives. Rising slightly over the past fortnight. Seat loss very likely. Majority very unlikely. Plurality moderately unlikely.
    • Labour. Fading slightly. Seat gain almost certain. Majority unlikely. Plurality probable.
    • Liberal Democrats. Holding steady. Seat loss almost certain.
    • SNP. Holding steady. Seat gain almost certain.
    • Plaid Cymru. Holding steady. Seat loss probable.
    • Greens. Holding steady. Seat loss possible.
    • UKIP. Holding steady. Seat gain almost certain.

Party Lo Seats Hi Swing
Conservatives 242 284 328 -22
Labour 254 297 338 39
Liberal Democrats 13 24 36 -33
SNP 13 21 30 15
Plaid Cymru 0 2 4 -1
Greens 0 0 1 -1
UKIP 1 3 6 3
Other 1 1 2 0
Seat-by-seat predictions based on the party predicted to be most likely to win each seat.

YOUGOV POLLING

https://yougov.co.uk/refer/HdvYK1txkm0PfdJX43_Iow/  <<< Follow the link if you would like to join the YOUGOV panel and have your opinions heard

http://cdn.yougov.com/cumulus_uploads/document/smviob5rvz/YG-Archive-Pol-Sun-results-271014.pdf 

COMRES POLLING

http://comres.co.uk/polls/The_Independent_Political_Poll_28th_October_2014_5632.pdf

Monday 27 October 2014

Ashcroft National Poll: Con 31%, Lab 31%, UKIP 18%, Lib Dem 7%, Green 5%

By
Labour and the Conservatives are level in this week’s Ashcroft National Poll, conducted over the past weekend. The Tories are up three points on last week to 31%, with Labour, the Liberal Democrats and UKIP unchanged on 31%, 7% and 18% respectively. After the last week’s surge to 8% and fourth place the Greens are back below the Lib Dems at their longer term average of 5%. The SNP scored 4%.
In other questions David Cameron and George Osborne led Ed Miliband and Ed Balls by 19 points (45% to 26%) on the question of who was most trusted to manage the economy in the best interests of Britain – a margin that is unchanged since I last asked the question in the ANP in June. Swing voters most trusted the Tory team by 31 points (50% to 19%), and UKIP voters by 39 points (56% to 17%). Nearly a quarter of Labour voters trusted Cameron and Osborne more than their own leaders.
This lead on economic management is valuable for the Conservatives but is put into perspective by a separate question on voters’ priorities. “Improving the NHS” topped the list of the most important issues both when respondents were asked to think about Britain as a whole and those affecting themselves and their families. Six in ten named the NHS in their top three issues facing the country, including 55% of men and 65% of women. Only 50% of Conservative voters mentioned the NHS, compared to 63% of swing voters (who say they do not know how they will vote or that they may change their mind before the election).
“Getting the economy growing and creating jobs” has fallen to second place since June, with 54% naming it in their top three issues for the country and 53% for themselves. “Controlling immigration” was in third place with 48% mentioning it in their top three issues for the country (including 82% of UKIP voters). However, only 33% put immigration among the top three issues facing themselves and their family, placing the issue fourth on that score behind “improving schools”, mentioned by 42%.
Despite the latest battles with Brussels only 14% (including only 20% of UKIP voters) named “protecting Britain’s interests in Europe” among the three biggest issues facing the country, and only 11% among those affecting them personally.
These findings sum up the balance the Conservatives will have to achieve over the next 27 weeks. The economy will rightly be a central part of the Tory campaign but it would be a risk to make it the exclusive message if public attention is shifting towards public services.
At the same time, events in Europe will need a strong response from the PM; my research has found that voters like to see him taking a robust stance even if he cannot win every fight. But the Tories must resist the temptation to be distracted by Europe at the expense of things that matter more to most voters.

Our blog is busier than SSP & SCOTTISH GREENS websites

Numbers do change on a daily basis (as it is a rolling 3 monthly figure) but today the figures are saying that thanks to all you lovely people we are busier than the Scottish Greens and Scottish Socialist Party.

(links are to ALEXA website)

UK GENERAL ELECTION 2015 BLOG 37,613
SCOTTISH SOCIALIST PARTY 41,841
THE SCOTTISH GREEN PARTY 66,753

The full charts can be viewed on the link, it is the snapshot as of 21st October Link to past political pop charts

A big thank you to everyone who comes and views the blog. YOU MADE THIS HAPPEN!!!

How come Ed Miliband still has his job?

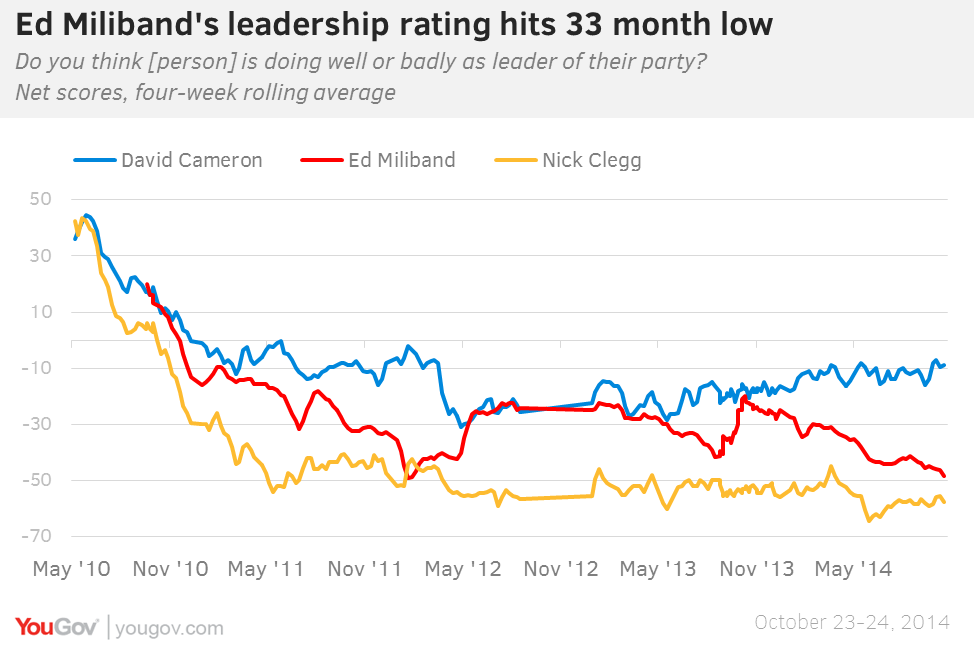
 Ed Miliband's leadership rating is the worst it has been since January 2012 from yougov and a 19.5% swing LABOUR to SNP and 92 LABOUR seats under threat from UKIP

The article below comes from Bruce on politics and puts it all into context

 Miliband Scotland 5
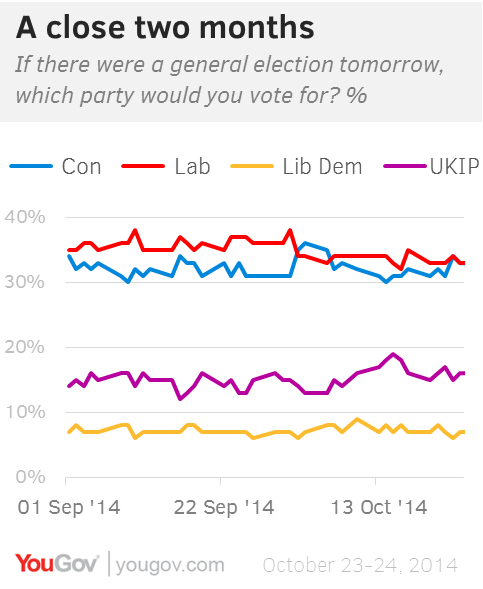
Looking at the raw data of opinion polls is very interesting. YouGov are especially impressive. They tell us that LibDem support has collapsed, that UKIP has about twice their support and that the Conservatives and Labour are running neck and neck. This is fabulous news for the Conservatives who should be doing far worse at this stage of the electoral cycle.
However the raw data does not reflect what happens on election day, for lots of reasons. Firstly the UK is not one homogeneous constituency, it is 650 separate ones, each with local issues, personalities and changing demographics. Many people vote tactically. Then there is the way people balance self interest against tribal loyalty on polling day. And of course there is the inevitable cycle of protest votes and mid term blues that greatly skew by-elections.
So there is a whole science to interpret, understand and discuss what is really happening below the raw data. This science is called Psephology. And we are very lucky that Steve Fisher, Associate Professor in Political Sociology and the Fellow and Tutor in Politics at Trinity College, University of Oxford is now blogging his analysis.  You can follow him on on Twitter @StephenDFisher. His latest blog predicts Con : 337 Lab : 265 LD  : 21 Con majority of 24. But that was based on Labour polling 38%. And now they are polling 33/34 %. So Labour are in huge electoral trouble.
But it gets even worse. Over very recent weeks we have seen two huge shifts away from Labour. Firstly in Scotland, where they have 40 seats. By gross mismanagement they have become extremely unpopular, nearly as toxic as the Conservatives in the region. With a huge shift to SNP. This is not some overnight whim, it is a massive change in public opinion. For decades you could put a red rosette on a chimpanzee in Scotland and they would get elected to Westminster, as we have seen many times. At the 2015 General Election Labour will be very lucky to retain 20 seats, and this alone could decide the election.
Labour 1400 reasons
The second slow motion train crash for Labour is the North of England. Here the metropolitan, middle class Labour party has totally lost any connection with their traditional blue collar support. Instead it is now UKIP that resonate best with the politics of a great swathe of voters and we are seeing it reflected in huge swings to UKIP at every electoral opportunity. 
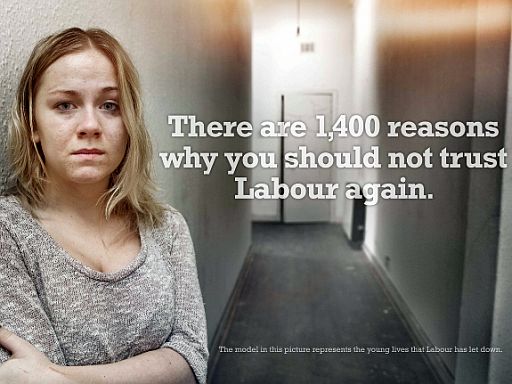
Events in Rotherham have further alienated these voters, to many the Labour party has become toxic. The North will now definitely return UKIP MPs, it is just a question of how many. Anything from 5 to 50! Whatever, it will take a huge chunk out of Labour’s capability to get an majority.
If I know this and can write about it then you can be sure that every Labour MP knows it, so there is a lot of dissatisfaction being voiced by them in Westminster, often now in public and to the press. There are reports of open revolt and of plots for a coup d’etat, hardly surprising when they are just a few months away from electoral meltdown.
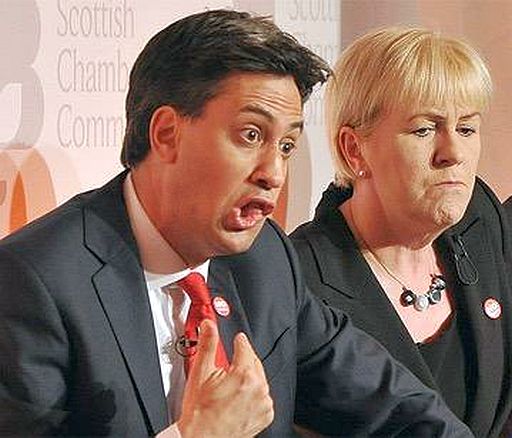
So how did Labour get into this disastrous situation at such a critical time in the electoral cycle? The answer is one man, Ed Miliband, who is such a disaster that he now receives huge ironic cheers from Conservative MPs every time he stands up in Parliament. They know full well that Miliband is ensuring a Conservative election victory.
Miliband became leader against the wishes of party MPs and of party members in the country. He is a trade union placeman and he owes his position to the power and patronage of just one man, Len McCluskey of the Unite union. So if you listen to what Len says on any issue you know that is what Miliband would deliver if he was Prime Minister. And this really is not what the vast majority of people want.
Balls always wrong 512
Ed Miliband is intellectually very clever, of that there is no doubt, in fact some would say that he verges onto the autistic spectrum. His personality seems to be based around control freakery, the condition known as Obsessive Compulsive Disorder (OCD), which is exactly what a leader does not need. He very quickly alienates other intelligent people, which is why you won’t find any in the shadow cabinet. Clever Labour MPs, like Alan Johnson, refuse to work with him. And we end up with ineptitudes like Ed Balls in senior positions, further dragging Labour down by being utterly useless at their jobs.
A huge problem for Labour is that they won’t tell us their policies. Obviously this is because these come from Red Len and will be unpopular. So we have the amazing sight of rich middle class metropolitan elites espousing the outdated politics of class warfare instead. The incongruity is immense. For example Miliband is promising to punish people who achieve in life with a Mansion Tax, but already he and his ministers have allocated the proceeds of this to over ten different areas of spending. It is a shambles and the voters of Britain can see that it is a shambles.
So Ed Miliband, purely on the strength of his own inability, is leading the Labour party to electoral oblivion, which has to be a very good thing for the best interests of Great Britain. In fact if he says in charge (which we all hope) we could see UKIP emerge as the opposition party. For all their nastiness, xenophibia and bigotry nobody can deny that Farage is an incredibly effective politician.

Do you care where your MP is from or where they live?

http://www.easypolls.net/poll.html?p=544e2782e4b0e6fe7d54de5c <<< link to poll

I wondered if people were bothered about where their MP came from? Too many times candidates are parachuted in to safe seats of all colours. So here is a poll asking the question.

Should a person wanting to represent a constituency in parliament be born and bred in that constituency?

3 answers (I don't do don't know)

follow the link above to cast your vote.

if you wish to comment feel free to use the commentary section below.

JIM A TONIC FOR SCOTTISH LABOUR?

Written by Graham Sharpe
 

POLITICAL punters believe Jim Murphy is the man to become the next permanent leader of the Scottish Labour Party, say bookmakers William Hill who originally offered the East Renfrewshire at 7/1 to succeed Johann Lamont, but were forced to slash those odds, cutting him eventually to 1/2 favourite, taking over from Anas Sarwar, who had been the original market leader.
'We certainly under-estimated the likely support for Mr Murphy who rapidly took over as hot favourite' said Hill's spokesman Graham Sharpe.

WILLIAM HILL.....NEXT PERMANENT SCOTTISH LABOUR LEADER: 1/ 2 Jim Murphy; 4/1 Anas Sarwar; 7/1 Gordon Brown; Kezia Dugdale; 10/1 Jackie Baillie; 16/1 Douglas Alexander; Neil Findlay; 20/1 Jenny Mara; Drew Smith; 33/1 Margaret Currie; Alistair Darling;
**William Hill make Labour 2/1 to win the 2016 Scottish Elections with the SNP 4/11 favourites.

Link to Graham Sharpe article

Link to polling data >>> SNP v LABOUR

LATEST POPULUS POLLING


http://www.populus.co.uk/wp-content/uploads/2014/10/OmOnline_Vote_27-10-2014_BPC.pdf

Ed Miliband's leadership rating is the worst it has been since January 2012

People always seem to say "Well, they never asked my opinion."  Would you like to change that?
https://yougov.co.uk/refer/HdvYK1txkm0PfdJX43_Iow/  <<< Follow the link if you would like to join the YOUGOV panel and have your opinions heard

Below is an article from YOUGOV link 

On October 2nd, the day after David Cameron's speech to the Conservative Party Conference, the Tories overtook Labour in voting intention for the first time since March 2012. The speech, which proposed a raise in the tax-free allowance, a pledge on 'English votes for English laws' and a raise in the threshold for the 40p tax rate, was well-received and led to a bounce for the Conservatives. Since then, in October Labour's lead over the Conservatives has averaged 2%, compared to an average 4% lead over the course of 2014, and in the two most recent YouGov polls the two main parties have been neck and neck.
This month the spotlight has been on David Cameron far more than Ed Miliband: borrowing was announced as higher this year than the last, UKIP gained its first MP at the Conservatives' expense and the Prime Minister's EU renegotiation project has come up against a series of hurdles. But new YouGov research for the Sunday Times reveals that for Ed Miliband the challenge remains as big as ever.
In the latest YouGov survey for the Sunday Times, Mr Miliband's leadership rating is the lowest (20% think he is doing well, 71% think he is doing badly) since January 2012 (18% well, 71% badly), when there was much speculation as to whether he would survive in the role.
His approval has been on a downward trend since its peak after the September 2013 conference; David Cameron's, by contrast, has steadily been on the rise since early 2013.
This weekend Ed Miliband has been blamed for the resignation of Johann Lamont, the Scottish Labour leader who has accused Labour's leadership in London of undermining her and treating Scottish Labour like a "branch office". Mr Miliband has been warned by Henry McLeish, a former Labour first minister of Scotland, that the party iss now facing a problem of “historic, epic proportions”. “If there’s any hiccup in the number of MPs we send to Westminster in 2015 this could be catastrophic for Ed Miliband’s effort to become prime minister”, he said.
PA Images
See the full poll results

Sunday 26 October 2014

SEVENOAKS VOTE SHARE 2014

UKIP 36.94% Conservatives 34.79% share from Euro 2014
Conservatives 56.8% UKIP 3.6% Share from GE2010

View image on Twitter

From electoral Calculus

Implied and predicted ward-by-ward votes for Sevenoaks

This table shows the (estimated) general election results broken down over each ward in the seat of Sevenoaks, as well as the predicted election result ward-by-ward.
SevenoaksEst. 2010 General Election ResultsPredicted Results
DistrictWardElectorate
2010
CON
Votes
LAB
Votes
LIB
Votes
Other
Votes
Total
Votes
CON
Votes
LAB
Votes
LIB
Votes
Other
Votes
Total
Votes
SevenoaksAsh4,6362,4424262431793,2902,159593564833,291
SevenoaksBrasted, Chevening and Sundridge4,7462,17506915043,3701,9232781581,0113,370
SevenoaksCrockenhill and Well Hill1,4980001,0641,0640001,0641,064
SevenoaksDunton Green and Riverhead3,5731,5990844942,5371,4142961936342,537
SevenoaksEynsford1,403502046430996444147106299996
SevenoaksFarningham, Horton Kirby and South Darenth3,7681,8105142021492,6751,600643463852,674
SevenoaksFawkham and West Kingsdown4,7912,3855732551883,4012,108741584943,401
SevenoaksHalstead, Knockholt and Badgers Mount2,6281,2040590711,8651,0642101354551,864
SevenoaksHextable3,1681,4964571711262,2501,323565393232,250
SevenoaksKemsing3,1751,5210643902,2541,3452381475242,254
SevenoaksOtford and Shoreham3,3441,3813685151122,3761,2215651184722,376
SevenoaksSeal and Weald3,0341,2320850732,1551,0892831955882,155
SevenoaksSevenoaks Eastern2,98853601,554322,1224744463568462,122
SevenoaksSevenoaks Kippington3,4241,78905361062,4311,5822201235072,432
SevenoaksSevenoaks Northern3,2261,03201,198612,2919123692757352,291
SevenoaksSevenoaks Town and St John's4,6921,85109275533,3311,6363292131,1533,331
SevenoaksSwanley Christchurch and Swanley Village4,3501,5101,0192343263,0891,3351,145545563,090
SevenoaksSwanley St Mary's3,1574451,4531981462,2423931,525452782,241
SevenoaksSwanley White Oak4,6771,4271,4202732013,3211,2621,553634443,322
SevenoaksWesterham and Crockham Hill3,3111,7383111741282,3511,536430403452,351
Total69,58928,0756,54110,5624,23349,40924,82010,5762,42011,59649,412
Please note that general election results and electorates are not officially made available ward-by-ward. The numbers shown are our best estimates for these figures, but are not official.

Below is the result from 2010 General Election
General Election 2010: Sevenoaks[10]
Party Candidate Votes % ±%

Conservative Michael Fallon 28,076 56.8 +5.0

Liberal Democrat Alan Bullion 10,561 21.4 −0.5

Labour Gareth Siddorn 6,541 13.2 −7.8

UKIP Christopher Heath 1,782 3.6 +0.6

BNP Paul Golding 1,384 2.8 N/A

English Democrats Louise Uncles 806 1.6 −0.1

Independent Mark Ellis 258 0.5 N/A
Majority 17,515 35.4 +5.4
Turnout 49,408 71.1 +12.4

Conservative hold Swing +3.1

DIY & VOTING

https://yougov.co.uk/refer/HdvYK1txkm0PfdJX43_Iow/  <<< Follow the link if you would like to join the YOUGOV panel and have your opinions heard

Not saying its the same old same old, but its votes that counts. and so looking down the questions I found this more interesting.

Page 11/12 has the polling info

http://cdn.yougov.com/cumulus_uploads/document/tg001pwhwn/YG-Archive-Pol-Sunday-Times-results-241014.pdf 

Saturday 25 October 2014

SNP v LABOUR

https://yougov.co.uk/refer/HdvYK1txkm0PfdJX43_Iow/  <<< Follow the link if you would like to join the YOUGOV panel and have your opinions heard

A list of SNP TARGET SEATS >>> LINK 
Below is the yougov polls used POLL FROM 2012
http://cdn.yougov.com/cumulus_uploads/document/ermwj0y6g0/YG-Archive-Pol-Sun-results-221012.pdf 

POLL FROM 2013
 http://cdn.yougov.com/cumulus_uploads/document/h2jnnj33da/YG-Archive-Pol-Sun-results-221013.pdf 

POLL FROM 2014
http://cdn.yougov.com/cumulus_uploads/document/np2h1yezwx/YG-Archive-Pol-Sun-results-221014.pdf