Well the excitement and traffic that an election brings is starting to ebb away from the figures and this can be seen by those parties ranked in the UK which dropped from 14 to 10. Most parties have seen a slight drop against the wider web and the excitements of sport, news, entertainment etc etc.
UKIP and Labour stay 1 and 2 with the Conservatives moving up due to the fact that other parties feel away more than they did. The biggest surprise is the ever increasing rise of J4MB who haven't actually stood a candidate anywhere, they do have plans for next years General Election but now find themselves above the Liberal Democrats and The Green Party.
Further down in the global section we find Sinn Fein is the 122 most popular website in the Isle of Man, it may suggest that the secure server service of the Isle of Man may have something behind this. But still an interesting stat from Alexa.
We find Plaid Cymru being over taken by the Monster Raving Loony party and the UUP almost become no data as the Patriotic Socialist Party take them as their first scalp.
Well it all makes an interesting look through, just what will happen with the conference season, Scottish Indy referendum and the next years election when will the interest kick in?
Last months rankings in brackets, each link is to the ALEXA page for the party not the parties website ALEXA RANKING EXPLAINED
UK RANKING
1 (1) UKIP 3,148
2 (2) LABOUR 6,758
3 (5) CONSERVATIVES 11,687
4 (6) SNP 12,682
5 (7) JUSTICE 4 MEN & BOYS 13,924
6 (3) LIBERAL DEMOCRATS 14,820
7 (4) THE GREEN PARTY 22,643
8 (9) PIRATE PARTY 39,306
9 (10) SCOTTISH SOCIALIST PARTY 53,395
10 (-) LEFT UNITY 77,795
UK GENERAL ELECTION 2015 BLOG 1,386,542
GLOBAL RANKING
SINN FEIN 427,621 (RANKED 122 IN THE ISLE OF MAN)
NHA PARTY 1,473,540
AN INDEPENDENCE FROM EUROPE PARTY 1,539,569
DEMOCRATIC UNIONIST PARTY 1,615,856
ENGLISH DEMOCRAT 1,644,277
RESPECT PARTY 1,734,868
TUSC 1,849,080
OMRLP 1,878,627
CHRISTIAN PARTY 2,338,975
PLAID CYMRU 2,929,897
THE LIBERAL PARTY 3,534,927
TUV 3,671,023
NONE OF THE ABOVE 3,949,822
THE ALLIANCE PARTY 3,973,699
MEBYON KERNOW 5,151,841
SOCIALIST LABOUR PARTY 5,354,114
NATIONAL LIBERAL PARTY 6,793,816
THE PEACE PARTY 7,373,133
SCOTTISH DEMOCRATIC ALLIANCE 8,552,510
PATRIOTIC SOCIALIST PARTY 12,231,533
ULSTER UNIONIST PARTY 13,400,031
NO DATA
NI21
THE BLUE PARTY
WESSEX REGIONALISTS
PEOPLES DEMOCRATIC PARTY OF GREAT BRITAIN
Links in to the website (Difference from last month)
CONSERVATIVES 2,489 (-2)
LABOUR 2,129 (+62)
LIBDEMS 1,815 (+68)
UKIP 1,375 (+155)
GREENS 1,193 (+81)
SNP 722 (+16)
SINN FEIN 663 (+15)
PIRATE PARTY 527 (-29)
PLAID CYMRU 322 (+7)
SSP 227 (+8)
LEFT UNITY 191 (+4)
UUP 181 (-6)
ALLIANCE 152 (+3)
TUSC 108 (+8)
J4MB 105 (+4)
OMRLP 98 (-5)
NHA PARTY 96 (+27)
ENG DEMS 96 (+7)
MEBYON KERNOW 80 (-2)
SOCIALIST LABOUR PARTY 74 (+1)
DUP 65 (-1)
LIBERAL PARTY 65 (+2)
RESPECT 63 (+7)
CHRISTIAN PARTY 49 (+9)
AN INDEPENDENCE FROM EUROPE 39 (+20)
TUV 39 (+4)
UK GENERAL ELECTION 2015 BLOG 34 (+6)
THE PEACE PARTY 32 (+7)
NATIONAL LIBERAL PARTY 28 (+4)
NONE OF THE ABOVE 20 (+9)
NI21 17 (+3)
SDA 9 (-2)
PATRIOTIC SOCIALIST PARTY 4 (+2)
WESSEX REGIONALISTS 2 (-2)
THE BLUE PARTY 1 (-)
PDPGB 0
% of people from the UK who visit the website
SCOTTISH SOCIALIST PARTY 100%
LIBDEMS 84.7%
SNP 80.9%
LEFT UNITY 79.3%
LABOUR 78.2%
CONSERVATIVES 74%
J4MB 69.4%
GREENS 62.6%
UKIP 51.5%
PIRATE PARTY 50.2%
PREVIOUS CHARTS
MAY 2014 POLITICAL POP CHART
APRIL 2014 POLITICAL POP CHART
END OF MARCH 2014 POLITICAL POP CHART
MARCH 2014 POLITICAL POP CHART
FEBRUARY 2014 POLITICAL POP CHART
JANUARY 2014 POLITICAL POP CHART
DECEMBER 2013 POLITICAL POP CHART
NOVEMBER 2013 POLITICAL POP CHART
OCTOBER 2013 POLITICAL POP CHART
SEPTEMBER 2013 POLITICAL POP CHART
AUGUST 2013 POLITICAL POP CHART
JULY 2013 POLITICAL POP CHART
JUNE 2013 POLITICAL POP CHART
MAY 2013 POLITICAL POP CHART
APRIL 2013 POLITICAL POP CHART
MARCH 2013 POLITICAL POP CHART
LIST OF FOLLOWERS ON TWITTER & FACEBOOK FOR EACH POLITICAL PARTY
JUNE 2014 PARTY POLITICAL CYBER WARRIORS CHART
MAY 2014 PARTY POLITICAL CYBER WARRIORS CHART
Yearly review of the party political cyber warriors May 2013 - May 2014
Saturday 28 June 2014
Friday 27 June 2014
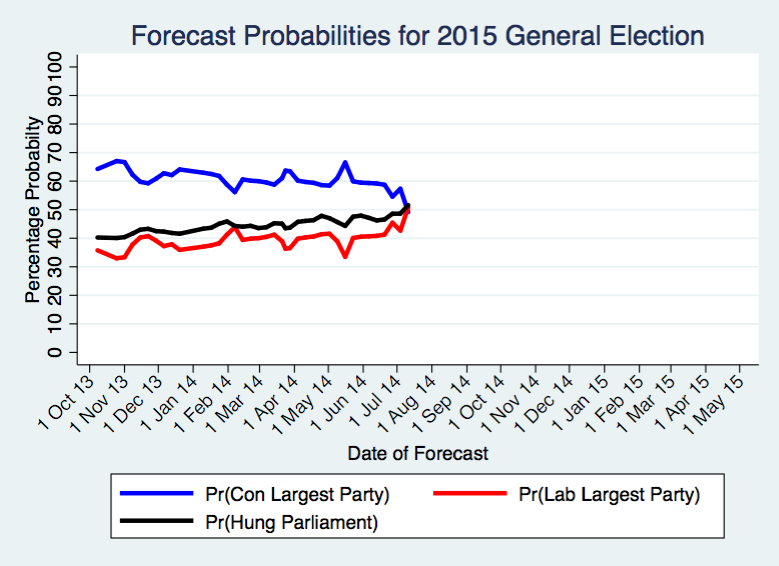
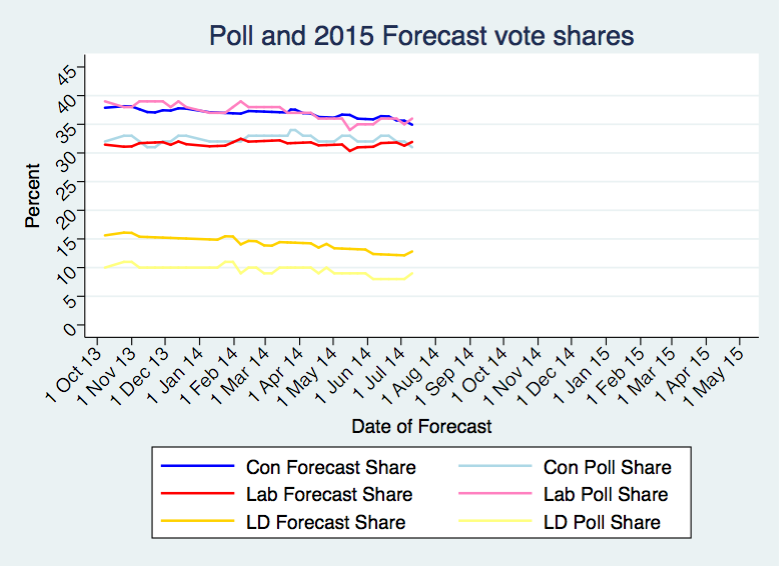
Long-range forecast for a 2015 British General Election based on current polls and historical polls and votes
This page gives details of
the current forecast from a new polls-based method for forecasting a general election
on 7th May 2015. The method was revised in February 2014 and is described in a working paper.
The original October 2013 working paper is here. There is also occasional commentary at
my Elections
etc. blog. To receive Tweets with updates of both the forecast and
commentary, follow me @StephenDFisher.
The approach is broadly to predict the next election
based on current opinion polls and the track record of polls in previous
electoral cycles, allowing for change in opinion in the run up to the election.
The method allows for three main historical tendencies: governments being more
likely to recover and oppositions fall back; parties moving back towards their
long-run average level of support and/or the level of support at the previous
election; and lastly and by far the least important tendency is for the
Conservatives to over perform and Labour to under perform their vote intention
figures in the polls when it comes to election day. All three suggest a Conservative
recovery and a Labour set back from autumn 2013. The statistical regression
methodology generates estimates of uncertainty and so prediction intervals
(range of likely outcomes) and probabilities for key events are also provided
below. The forecast represents a way to think about the
implications of current opinion polls for the outcome of the next general
election in light of the historical relationship between polls and election
results. It is the product of a statistical analysis of the data and not my
personal opinion about what will happen.
Date of forecast: 27.06.2014
Days till the election: 314
Inputted current average poll shares
Con : 32 -1
Lab : 36
LD : 8
Oth : 24 +1
UKIP: 15 +1 so UKIP share of combined Others vote is 63%
Forecast Election Day Shares with 95% Prediction Intervals
Con : 35.7 plus or minus 7.8 i.e. between 28 and 43
Lab : 31.8 plus or minus 5.8 i.e. between 26 and 38
LD : 12.2 plus or minus 8.9 i.e. between 3 and 21
Implied point estimate shares for:
Others combined: 20.3
UKIP :
12.7 (based on share of combined Others vote.)
Forecast Election Day Seats (changes from last week)
Con : 302 (-5)
Lab : 292 (+4)
LD : 28 (+1)
Con largest party, but short of a
majority by 24 (+5)
Forecast Election Day Seats with approximate 95% Prediction Intervals
Assuming LD share at 12.2 and Other share at 20.3 and allowing Con and Lab to vary as per
intervals above.
Con between 219 and 398
Lab between 201 and 369
LD between 22 and 35
Approximate probabilities of key outcomes
Pr(Con largest
party) = 55% -4%
Pr(Lab largest
party) = 45% +4%
Pr(Con majority) =
29% -5%
Pr(Lab majority) =
22% +3%
Pr(Hung
parliament) = 49% + 2%
Pr(Hung parliament with Con largest party) = 26%
Pr(Hung parliament
with Lab largest party) = 23%
The inputted current polling average is that from UK Polling Report,
chosen because it is sensible, convenient and frequently updated. But this is
not a claim that this is necessarily the best estimate of current opinion and
it would be reasonable to use other methods of averaging recent polls. On
occasion I will adjust the polling average to make it more up to date.
I try to update the forecast every week, and mostly on
Fridays.
Acknowledgements: I am very grateful for comments to John Curtice,
Jouni Kuha, Clive Payne,
Mark Pickup and Chris Prosser, and to Rob Ford, Will Jennings and Chris Wlezien for early discussions about this work. I am also
very grateful for the numerous and wide ranging comments on Twitter and
elsewhere online in response to previous drafts. The paper has been revised
substantially in part thanks to them. Most especially, I am indebted to Will
Jennings for compiling and preparing the historical polling data. The
methodology is a combination of previously developed techniques with
refinements and new developments. Please see the working paper for full details
including citations to previous related methods.
Department of Sociology
University of Oxford
Manor Road
Oxford OX1 3UQ
stephen.fisher@
sociology.ox.ac.uk or trinity.ox.ac.uk
Tuesday 24 June 2014
Lord Ashcrofts weekly opinion poll
Lord Ashcroft polling
LABOUR 33%
CONSERVATIVES 28%
UKIP 17%
LIBDEMS 9%
— General Election (@UKELECTIONS2015) June 24, 2014
By Lord Ashcroft
The Labour lead is down to five points in this week’s Ashcroft National Poll, conducted between Friday and Sunday. Labour are down two points to 33%, with the Conservatives down one to 28%, the Liberal Democrats up one to 9% and UKIP up two on 17%. Other parties account for 14%, including the Greens up one point on 7%.
Just over half of all voters said they would definitely vote for their chosen party next May, with 47% saying they may yet change their mind. Labour supporters (63%) and Conservatives (59%) were the most likely to be certain how they will vote. Those who said they would vote UKIP were evenly divided as to whether they were certain to stay with the party (51% said they would definitely vote that way, 49% that they may end up voting differently), and 63% of Lib Dems said they may switch.
I asked people whether they thought each of the four main parties had certain attributes. The Conservatives were most likely to be thought to possess three: being “willing to take tough decisions for the long term” (with 50% saying this was true of the party), being “competent and capable” (42%) and having “clear ideas to deal with Britain’s problems” (41%). The Tories’ lowest scores included “standing for fairness” (32%) and being “on the side of people like me” (31%).
Labour led in six areas: having its “heart in the right place” (52%), standing for fairness (50%), being “reasonable and sensible” (46%, just two points ahead of the Tories), “shares my values” (41%), being “on the side of people like me” (41%) and being “honest and principled” (only 38%, but ahead of the other parties on this measure).
While the Tories lagged behind on some of these character attributes, Labour’s lowest scores included having clear ideas to deal with Britain’s problems (34%) and being competent and capable (37%). With just months until an election, which of these two combinations of qualities would Ed Miliband choose for his party? To put it another way, when it comes to choosing a government, will voters value empathy over ability?
Despite everything, the Liberal Democrats scored highly on having their heart in the right place (43%) and standing for fairness (42%) – something that voters have continued to associate with the party even if they are not convinced Nick Clegg has been able to put his principles into effect in government. Only around one fifth of voters thought the Lib Dems were united, competent or had clear ideas.
Perhaps not surprisingly, UKIP’s most recognised attribute was that it “says things that need to be said that other parties are scared to say” (57%). Despite this, only 27% thought the party was “reasonable and sensible” (the lowest score for any party on this measure) and just 29% thought UKIP shared their values. People seem more likely to acknowledge UKIP for saying the unsayable on certain issues than to think the party is speaking for them more generally – indeed the proportion saying UKIP were “on the side of people like me” (33%) was little higher than for the Conservatives (31%). Even so, it will be the Tories who should be more exercised by the fact that only just over three voters in ten think the party is fighting their corner.
Survation marginal polling
- In new, targeted constituency telephone research by Survation on behalf of the RMT, voters rejected private rail franchise operators in key Conservative held 2015 battleground seats required for a Labour 2015 majority.
- A clear majority of Labour, Liberal Democrat and UKIP voters reject the current status quo based on perception of lower fare prices and the hope of better service under public versus private ownership
- Almost one half of Conservative 2010 voters would bring their local rail operator back under public ownership at the next opportunity
It has been previously established in polling by Survation, YouGov and others that continued private ownership of the UK’s train operating companies is unpopular.
In this research Survation were interested as to what extent changing government policy in the UK in this area would assist a party electorally that advocated change from the current status quo specifically in the type of seats essential to Labour’s pursuit of an overall majority in 2015. 4 key marginal Conservative/Labour "battleground" seats of
Crawley (CON), Stevenage (CON), Reading West (CON) and Milton Keynes South (CON)
Combined Voting Intention Across the 4 Seats (with comparison to 2010)
CON 34% (-8)
LAB 38% (+6)
LD 2% (-15)
UKIP 19% (+15)
AP 7% (+3)
- 74% of respondents expressing an opinion (removing "don't knows") did not believe their service would be worse run in public vs private hands.
- 71% of respondents that expressed an opinion thought fare prices would be either the same or cheaper than now. Half of all respondents thought fares would be cheaper under public ownership.
- 60% of all respondents expressing a view told Survation they wanted their own local operator to be brought back under public ownership at the next opportunity, a view shared by 62% of Lib Dem 2010 voters, 71% of Labour 2010 voters and even 47% of 2010 Conservatives.
Between 17th-19th June Survation polled 1011 constituents by telephone in 4 key marginal Conservative/Labour "battleground" seats of Crawley (CON), Stevenage (CON), Reading West (CON) and Milton Keynes South (CON). Data gathered were weighted to the profile of all adults across the 4 seats and data were weighted by age, gender and an adjustment made to account for relative constituency size. Full tables are here.
Monday 23 June 2014
UK General Election 2015 Probability of each outcome:
| 1 day | 7 day | ||
|---|---|---|---|
| Hung Parliament | 43.54% | ||
| Labour Majority | 30.08% | ||
| Conservative Majority | 25.79% | ||
| Other Party Majority | 0.58% | ||
| Updates every hour. Last Updated: 09:00:43, Mon 23 June 2014 |
Percentage outcome based on the Betfair back price for each selection, compensating for the overround.
Any discrepancy between the total probability and 100% is due to rounding.
Sunday 22 June 2014
YOUGOV - Some Labour voters thoughts on Ed Miliband
Labour have a6% point lead in the opinion polls but below is some of their own partys voters thoughts about the Leader. Not looking good, if he does win just what a squabble could it be?
31% of Labour voters say Ed Miliband would NOT be up to the job of being Prime Minister
— General Election (@UKELECTIONS2015) June 22, 2014
49% of Labour voters said they would be MORE likely to win the next election with a different party leader.
— General Election (@UKELECTIONS2015) June 22, 2014
#KillerBlow
56% of Labour voters agree that Ed Miliband has the right policies, but does NOT look or sound like a possible Prime Minister
— General Election (@UKELECTIONS2015) June 22, 2014
26% of Labour voters think that Labour won't win enough MPs to form the next government
— General Election (@UKELECTIONS2015) June 22, 2014
41% of Labour voters think Ed Miliband is doing badly as leader.
Compared to
10% Tories think same of Cameron
49% LibDems same of Clegg
— General Election (@UKELECTIONS2015) June 22, 2014
http://cdn.yougov.com/cumulus_uploads/document/mjjvoa38px/YG-Archive-Pol-Sunday-Times-results-200614.pdf
Friday 20 June 2014
Long-range forecast for a 2015 British General Election based on current polls and historical polls and votes
Stephen Fisher, University of Oxford
This page gives details of the
current forecast from a new polls-based method for forecasting a general
election on 7th May 2015. The method was revised in February 2014 and is
described in a working paper.
The original October 2013 working paper is here. There is also occasional commentary at
my Elections
etc. blog. To receive Tweets with updates of both the forecast and
commentary, follow me @StephenDFisher.
The approach is broadly to predict the next election
based on current opinion polls and the track record of polls in previous
electoral cycles, allowing for change in opinion in the run up to the election.
The method allows for three main historical tendencies: governments being more
likely to recover and oppositions fall back; parties moving back towards their
long-run average level of support and/or the level of support at the previous
election; and lastly and by far the least important tendency is for the
Conservatives to over perform and Labour to under perform their vote intention
figures in the polls when it comes to election day. All three suggest a
Conservative recovery and a Labour set back from autumn 2013. The statistical
regression methodology generates estimates of uncertainty and so prediction
intervals (range of likely outcomes) and probabilities for key events are also
provided below. The forecast represents a way to think about the
implications of current opinion polls for the outcome of the next general
election in light of the historical relationship between polls and election
results. It is the product of a statistical analysis of the data and not my
personal opinion about what will happen.
Date of forecast: 20.06.2014
Days till the election: 321
Inputted current average poll shares
Con : 33
Lab : 36
LD : 8
Oth : 23
UKIP: 14 so UKIP share of combined Others vote is 61%
Forecast Election Day Shares with 95% Prediction Intervals
Con : 36.4 plus or minus 7.8 i.e. between 29 and 44
Lab : 31.8 plus or minus 5.9 i.e. between 26 and 38
LD : 12.3 plus or minus 9 i.e. between 3 and 21
Implied point estimate shares for:
Others combined: 19.5
UKIP :
11.9 (based on share of combined Others vote.)
Forecast Election Day Seats
Con : 307
Lab : 288
LD : 27
Con largest party, but short of a
majority by 19
Forecast Election Day Seats with approximate 95% Prediction Intervals
Assuming LD share at 12.3 and Other share at 19.5 and allowing Con and Lab to vary as per
intervals above.
Con between 223 and 404
Lab between 196 and 366
LD between 22 and 34
Approximate probabilities of key outcomes
Pr(Con largest
party) = 59%
Pr(Lab largest
party) = 41%
Pr(Con majority) =
34%
Pr(Lab majority) =
19%
Pr(Hung
parliament) = 47%
Pr(Hung parliament
with Con largest party) = 25%
Pr(Hung parliament
with Lab largest party) = 22%
The inputted current polling average is that from UK Polling Report,
chosen because it is sensible, convenient and frequently updated. But this is
not a claim that this is necessarily the best estimate of current opinion and
it would be reasonable to use other methods of averaging recent polls. On
occasion I will adjust the polling average to make it more up to date.
I try to update the forecast every week, and mostly on
Fridays.
Acknowledgements: I am very grateful for comments to John Curtice,
Jouni Kuha, Clive Payne,
Mark Pickup and Chris Prosser, and to Rob Ford, Will Jennings and Chris Wlezien for early discussions about this work. I am also
very grateful for the numerous and wide ranging comments on Twitter and
elsewhere online in response to previous drafts. The paper has been revised
substantially in part thanks to them. Most especially, I am indebted to Will
Jennings for compiling and preparing the historical polling data. The
methodology is a combination of previously developed techniques with
refinements and new developments. Please see the working paper for full details including
citations to previous related methods.
Department of Sociology
University of Oxford
Manor Road
Oxford OX1 3UQ
stephen.fisher@
sociology.ox.ac.uk or trinity.ox.ac.uk
The Conservative – Lib Dem battleground
Forever insightful thoughts from Lord Ashcroft, piece was from his blog Lord Ashcrofts blog hope you enjoy the analysis
By Lord Ashcroft
At the 2010 general election the Liberal Democrats won 24% of the popular vote. By the end of that year the party’s share in national polls had fallen by half, and it has since shown no sign of recovering. Whether this collapse in national support means the Lib Dems lose a proportionate number of seats is one of the most important factors that will determine the outcome of the next election.
The Lib Dems are famously tenacious local campaigners. Their strategy has long been to build support at constituency level through by-elections and local government, and once elected their incumbents have proved hard to shift. Last year’s Eastleigh by-election showed the party can still mobilise its council base to hold on to a Westminster seat in spite of wider conditions. If they are able to repeat this feat at a general election, could there be rather more Lib Dem MPs in the new House of Commons than the current national polls imply?
My latest polling in 17 marginal seats closely contested between the Lib Dems and the Conservatives suggests that in some places Nick Clegg’s party may indeed defy the national trend. But according to this snapshot, the party risks losing a dozen or more seats to the Conservatives.
Across the Tory-Lib Dem battleground I found the Conservative vote share down 8 points since 2010 to 33% – but the Lib Dems down by nearly twice that, falling 15 points to 28%. Labour were up 5 points on their general election performance to 14% in these seats, and UKIP up 14 points to 18%.
These figures are based on a variation of the standard voting intention question that simply asks which party the respondent which party they would vote for if there were an election tomorrow. The heavily localised nature of Lib Dem support means a more accurate way of measuring voting intention where the party is in contention is to ask people to think about where they live: “Thinking specifically about your own parliamentary constituency at the next general election and the candidates who are likely to stand for election to Westminster there, which party’s candidate do you think you will vote for in your own constituency?”
Even on this more realistic formulation, the results amount to an effective 3.5% swing from the Lib Dems to the Tories since 2010. This would be enough for the Conservatives to unseat 15 Lib Dem MPs if this were to happen across the board next May.
But one big lesson from this research is not to assume any kind of uniform swing where the Lib Dems are concerned. The swing to the Tories was as high as 9% in Newton Abbot, but in the Lib Dem-held seats of Cheadle, Eastleigh and Sutton & Cheam the swing was in the other direction. There was also no straightforward regional pattern. Though swings were generally less favourable to the Tories in urban and suburban seats, in Cornwall they ranged from 2.5% (St Ives) to 8% (Truro & Falmouth). The swing to the Conservatives in Wells (3%) was less than half than in neighbouring Somerton & Frome (7.5%).
UKIP’s vote share ranged from 11% (Oxford West & Abingdon) to 26% (Camborne & Redruth. Nigel Farage’s party was in second or joint second place in Camborne & Redruth, Newton Abbot, Truro & Falmouth, and St Austell & Newquay. Just over one in six (17%) of 2010 Conservative voters said they would vote UKIP in the battleground as a whole.
But UKIP are not just a problem for the Tories. Those who voted Lib Dem at the last election were as likely to say they would switch to UKIP (13%) as to say they would switch to Labour (13%). A further 11% said they intended to vote Conservative. The party is literally losing votes right, left and centre.
The number of Lib Dem defectors to UKIP is not as surprising as it might seem at first glance. Before 2010, many voters saw the Lib Dems as the left-wing alternative to Labour, but for many others they were England’s premier none-of-the-above party (there were also some principled liberals, most of whom are sticking with Mr Clegg). Now the Lib Dems are very much one-of-the-above, and their presence in the coalition makes them less attractive to anti-Tory voters even in parts of the country where Labour are not a factor. UKIP is the ideal vehicle for such people.
Only one in five voters in the Lib Dem-Con battleground said they would rather see Ed Miliband as Prime Minister than David Cameron. Less than a quarter of Lib Dem voters (23%) and less than a fifth of UKIP voters (19%) said they would prefer to see Miliband in Number Ten, as did only two thirds of Labour voters. Nearly nine out of ten (89%) Conservative defectors to UKIP said they would rather see Cameron as PM than the alternative.
Overall, two thirds were optimistic about the economy over the next year, both for themselves and the country. Nearly nine in ten Tories expected the economy to do well, as did three quarters of Lib Dems and just over half of Labour and UKIP voters.
Asked what they would most like to see as the outcome of the next election, Lib Dem voters on the battleground were more likely to say they wanted another coalition with the Tories (42%) than with Labour (35%).
UKIP voters were much more likely than any other party’s supporters to say they did not know what kind of government they wanted to see (19%). Half wanted to see the Conservatives in government either with an overall majority (35%) or in coalition with the Lib Dems (14%). One in five wanted a Labour government, and 11% chose a Labour-Lib Dem coalition.
Nearly two thirds (65%) of Conservative defectors to UKIP said a Tory government was what they would most like to see. Those switching from the Lib Dems to UKIP were quite evenly divided between preferring a Conservative government (20%), a Labour government (21%), a Conservative-Lib Dem coalition (16%), a Labour-Lib Dem coalition (21%), and not knowing what they wanted (22%).
As I found last month in the Conservative-Labour battleground, the ground campaigns in these seats looks very closely fought. Half of all voters said they had had literature, direct mail, visits or telephone calls from the Lib Dems, while 48% said they had heard from the Tories, 46% from UKIP and 30% from Labour. These levels are high because of the recent local and European elections, but what matters is that they are quite even. We will see in future rounds of research whether this continues to be the case in relative “peacetime”, when the Lib Dems’ incessant leaflet-mongering can make its mark.
I make no apology for my continued repetition of the fact that a poll is a snapshot, not a forecast. As I have found in my national polling, around half of all voters say they may yet change their minds from their current party. In these 17 seats, just over six in ten (61%) Lib Dem switchers to UKIP rule out going back to their old party. Only half of Lib Dem defectors to Labour and one third of those switching to the Tories say they will definitely not return. Some of the constituency results are very tight, and there is plenty of room for movement over the next eleven months.
Despite that, these findings are clearly not good news for the Lib Dems, and as such will no doubt be reported as “adding to the pressure on Clegg”. And no doubt it will cause some discomfort, which may or may not be eased when I publish my research on the Lib Dem-Labour battleground, currently in the field.
But taken together with my previous research on the Lib Dems’ predicament, it is hard to see how replacing Clegg before the election would amount to anything more than a ritual sacrifice.
The Lib Dems are in their current position not because of anything Nick Clegg himself has done or not done, but because his party is in government with the Conservatives – a decision endorsed by the whole party through its exhaustive processes of internal democracy. The centre-right coalition already has a left-wing alternative, led by Ed Miliband. Former Lib Dem voters who switched because they were dismayed that the party entered office with the Tories would only consider coming back if the party promised not to make the same decision in 2015, no matter what the election result. Such a declaration is surely unthinkable, or ought to be for a party that wants to have any influence on the nation’s affairs. It would also look a bit rum to the voters: campaigning as the left-wing alternative to the left-wing alternative after five years in government with David Cameron, George Osborne, Theresa May, Iain Duncan Smith and Michael Gove would surely be a bit of a stretch.
- Download the Full Report
- Data tables - Con-Lib Dem battleground
- Data tables - Camborne & Redruth
- Data tables - Cheadle
- Data tables - Chippenham
- Data tables - Eastleigh
- Data tables - Harrogate & Knaresborough
- Data tables - Mid Dorset & North Poole
- Data tables - Newton Abbot
- Data tables - North Cornwall
- Data tables - Oxford West & Abingdon
- Data tables - Solihull
- Data tables - Somerton & Frome
- Data tables - St Austell & Newquay
- Data tables - St Ives
- Data tables - Sutton & Cheam
- Data tables - Truro & Falmouth
- Data tables - Watford
- Data tables - Wells
Thursday 19 June 2014
YOUGOV ( VOTING INTENTION vs WHO'D MAKE THE BEST PM?)
This is a theme which seems to carry on poll after poll, people will be voting Labour, but they seem to have no faith in the leader. Miliband always seems to lose the support of his own voters.As he can create a 14.5% swing in his own heartlands of the North with Labour 20% in the lead with votes but he is 9% behind Cameron when asked who people think would be the best PM? I wonder what the true thoughts of Labours hierarchy are to all this?
YOUGOV
N.ENGLAND
LAB 49%
CON 29%
UKIP 12%
LD 6%
GREEN 3%
Who'd make best PM?
Cameron 34%
Miliband 25%
Clegg 3%
— General Election (@UKELECTIONS2015) June 19, 2014
YOUGOV
LONDON
LAB 41%
CON 36%
LD 12%
UKIP 7%
GREEN 4%
Who'd make best PM?
Cameron 37%
Miliband 17%
Clegg 5%
— General Election (@UKELECTIONS2015) June 19, 2014
YOUGOV
S. ENGLAND
CON 40%
LAB 28%
UKIP 16%
LD 8%
GREEN 7%
Who'd make best PM?
Cameron 44%
Miliband 14%
Clegg 3%
— General Election (@UKELECTIONS2015) June 19, 2014
YOUGOV
MIDLANDS / WALES
LAB 38%
CON 33%
UKIP 16%
LD 5%
GREEN 4%
PC 2%
Who'd make best PM?
Cameron 36%
Miliband 18%
Clegg 3%
— General Election (@UKELECTIONS2015) June 19, 2014
YOUGOV
SCOTLAND
LAB 36%
SNP 26%
CON 22%
LD 7%
UKIP 6%
GREEN 4%
Who'd be best PM?
Cameron 28%
Miliband 24%
Clegg 2%
— General Election (@UKELECTIONS2015) June 19, 2014
http://cdn.yougov.com/cumulus_uploads/document/73j1ttengp/YG-Archive-Pol-Sun-results-180614.pdf
Wednesday 18 June 2014
We need to talk about "ED"
I wonder just what conversations are being had about the Labour leadership, at present everyone seems to be on message. But surely the same message must be getting thru somewhere. Labour are leading the polls, Ed is leading them potentially to no mans land of a hung parliament.
It seems the electorate think his best trait, is that he is in touch with the ordinary person. rating higher than any of the other leaders. So it seems he feels your pain, and he also scores above average for sticking to what he believes in. But when it actually comes down to strong leadership, being good in a crisis, and generally the traits where it means you are getting the job done. He rates lower than Nick Clegg even in his own heartland.
Now if Labour were a football team, would they be looking to sack their manager before the transfer window? September and the conference season is the last chance so any new leader could come in and rally the troops. But it is too late for that really as all the other parties would have a field day. I just wonder if some sort of event will come to pass. Time with the family is needed, because at present it seems Labour are on the cusp of victory and the Conservatives ace card is Ed Miliband.
In Labour heartlands the NorthEast Clegg out performs Miliband
Good in a crisis
Clegg 3% Miliband 1%
A natural Leader
Clegg 3% Miliband 2%
— General Election (@UKELECTIONS2015) June 18, 2014
45% of people in the NE England would vote Labour
But only 1% think Ed Miliband is a natural leader & 2% say he would be good in a crisis
— General Election (@UKELECTIONS2015) June 18, 2014
http://cdn.yougov.com/cumulus_uploads/document/1qw29439o2/YG-Archive-Pol-Sun-results-170614.pdf
ICM OPINION POLL (MEN V WOMEN)
ICM POLLING
Male voting intentions
CONSERVATIVES 31%
LABOUR 29%
UKIP 21%
LIBDEMS 8%
GREENS 5%
SNP 4%
— General Election (@UKELECTIONS2015) June 18, 2014
ICM POLLING
Female voting intentions
LABOUR 36%
CONSERVATIVES 31%
UKIP 12%
LIBDEMS 8%
GREENS 6%
SNP 4%
PLAID CYMRU 1%
— General Election (@UKELECTIONS2015) June 18, 2014
http://www.icmresearch.com/data/media/pdf/2014_guardian_june.pdf
Tuesday 17 June 2014
How a LibDem meltdown or recovery would affect the General Election.
Something I found on my travels by Peter Kellner
Read the full article http://yougov.co.uk/news/2014/06/16/how-lib-dem-prospects-affect-arithmetic-ve-day/
For each scenario, I show two seat calculations. In each case, the ‘uniform swing’ figures show what would happen if the percentage movement of votes were the same in every constituency. I have used the calculator provided by my colleague Anthony Wells’ Polling Report website.
The ‘adjusted’ figures show my best guesses of what would actually happen with these voting percentages. They vary from the ‘uniform swing’ figures in two ways. First, I assume that the personal following of Lib Dem MPs will help the party to retain eight seats it would otherwise lose – five to the Conservatives and three to Labour. Second, I assume that first-time Tory MPs will benefit from a ‘sophomore surge’ – just as Labour MPs elected for the first time in 1997 held more seats in 2001 than would have been expected on the national 2% swing to the Conservatives. (For a discussion of this phenomenon, see my blog earlier this year here). For the purposes of this analysis, I assume this is worth 18 seats to the Tories – seats they would lose on a uniform swing but in practice keep.
The combined effect of these two adjustments is to add 13 seats net to the Conservative tally and 8 to the Lib Dems, and cost Labour 21 seats. (I assume that UKIP will subside to around 10% and not have any MPs in the new Parliament.)
Three clear conclusions emerge:
1. The geographical bias in Labour’s favour largely disappears. Suppose both Labour and the Conservatives win the same number of votes. On a uniform swing, Labour would have either 35 more MPs (in the case of a Lib Dem meltdown) or 44 (Lib Dem recovery). But the adjusted figures reduce Labour’s lead to one (meltdown) or ten (recovery).
2. Labour must also abandon its hopes of winning an overall majority with a narrow lead in the popular vote. Depending on Lib Dem performance and the precise size of the Tories’ sophomore surge, Labour’s lead needs to be at least 3% and possibly 5%.
3. Conversely, the Tories could win enough seats to govern alone with a lead in the popular vote of just 2% (Lib Dem meltdown) or 4% (Lib Dem recovery). Such leads would not give the Conservatives the 326 seats they need for an overall majority, but enough to exceed the combined total of Labour and Lib Dems seats – the minimum that they will probably need to run a one-party minority government, at least for a while. (For those interested in the minutiae of these things, I assume that Northern Ireland’s 8-9 Democratic Unionists would support a minority Tory government in a confidence vote, while the Green, Scottish National and Plaid Cymru MPs would not.)
I would add a fourth conclusion, though this is more speculative. Let’s suppose Labour and the Tories enter next year’s election campaign level-pegging on 37% each, with the Lib Dems languishing on 8%. Then, on my adjusted figures, the contest to be the largest party will be too close to call.
Read the full article http://yougov.co.uk/news/2014/06/16/how-lib-dem-prospects-affect-arithmetic-ve-day/
For each scenario, I show two seat calculations. In each case, the ‘uniform swing’ figures show what would happen if the percentage movement of votes were the same in every constituency. I have used the calculator provided by my colleague Anthony Wells’ Polling Report website.
The ‘adjusted’ figures show my best guesses of what would actually happen with these voting percentages. They vary from the ‘uniform swing’ figures in two ways. First, I assume that the personal following of Lib Dem MPs will help the party to retain eight seats it would otherwise lose – five to the Conservatives and three to Labour. Second, I assume that first-time Tory MPs will benefit from a ‘sophomore surge’ – just as Labour MPs elected for the first time in 1997 held more seats in 2001 than would have been expected on the national 2% swing to the Conservatives. (For a discussion of this phenomenon, see my blog earlier this year here). For the purposes of this analysis, I assume this is worth 18 seats to the Tories – seats they would lose on a uniform swing but in practice keep.
The combined effect of these two adjustments is to add 13 seats net to the Conservative tally and 8 to the Lib Dems, and cost Labour 21 seats. (I assume that UKIP will subside to around 10% and not have any MPs in the new Parliament.)
| Lib Dem Meltdown | Lib Dem Recovery | |||||
| Vote % | Uniform swing seats | Adjusted Seats | Vote % | Uniform Swing Seats | Adjusted Seats | |
| 2% Con Lead | ||||||
| Con | 38 | 300 | 313 | 35 | 286 | 299 |
| Lab | 36 | 313 | 292 | 33 | 305 | 284 |
| LD | 8 | 11 | 19 | 14 | 31 | 39 |
| Others | 18 | 26 | 26 | 26 | 28 | 28 |
| Con, Lab Level | ||||||
| Con | 37 | 289 | 302 | 34 | 272 | 285 |
| Lab | 37 | 324 | 303 | 34 | 316 | 295 |
| LD | 8 | 11 | 19 | 14 | 34 | 42 |
| Others | 18 | 26 | 26 | 18 | 18 | 28 |
| 2% Lab Lead | ||||||
| Con | 36 | 275 | 288 | 33 | 259 | 272 |
| Lab | 38 | 334 | 313 | 35 | 328 | 307 |
| LD | 8 | 15 | 23 | 14 | 36 | 44 |
| Others | 18 | 26 | 26 | 18 | 27 | 27 |
1. The geographical bias in Labour’s favour largely disappears. Suppose both Labour and the Conservatives win the same number of votes. On a uniform swing, Labour would have either 35 more MPs (in the case of a Lib Dem meltdown) or 44 (Lib Dem recovery). But the adjusted figures reduce Labour’s lead to one (meltdown) or ten (recovery).
2. Labour must also abandon its hopes of winning an overall majority with a narrow lead in the popular vote. Depending on Lib Dem performance and the precise size of the Tories’ sophomore surge, Labour’s lead needs to be at least 3% and possibly 5%.
3. Conversely, the Tories could win enough seats to govern alone with a lead in the popular vote of just 2% (Lib Dem meltdown) or 4% (Lib Dem recovery). Such leads would not give the Conservatives the 326 seats they need for an overall majority, but enough to exceed the combined total of Labour and Lib Dems seats – the minimum that they will probably need to run a one-party minority government, at least for a while. (For those interested in the minutiae of these things, I assume that Northern Ireland’s 8-9 Democratic Unionists would support a minority Tory government in a confidence vote, while the Green, Scottish National and Plaid Cymru MPs would not.)
I would add a fourth conclusion, though this is more speculative. Let’s suppose Labour and the Tories enter next year’s election campaign level-pegging on 37% each, with the Lib Dems languishing on 8%. Then, on my adjusted figures, the contest to be the largest party will be too close to call.
Subscribe to:
Posts (Atom)